Most creators open their analytics, see a number, think "huh, nice" or "huh, not great", and close the tab.
That's understandable. Analytics dashboards are full of charts, and it's not obvious what you're supposed to do with any of them. But your link-in-bio analytics are one of the most useful tools you have, because they show what happens at the exact moment someone goes from "watching your content" to "doing something about it."
This guide goes through the numbers one by one: what each one means, what "good" looks like, and — most importantly — what to change because of it.
The big picture: your page is a funnel
Before diving into individual numbers, it helps to see how they connect. Every visit to your link in bio follows roughly the same path:
- Someone sees your content on Instagram, TikTok, YouTube, wherever.
- They visit your page. (Profile views)
- They click something. (Link clicks)
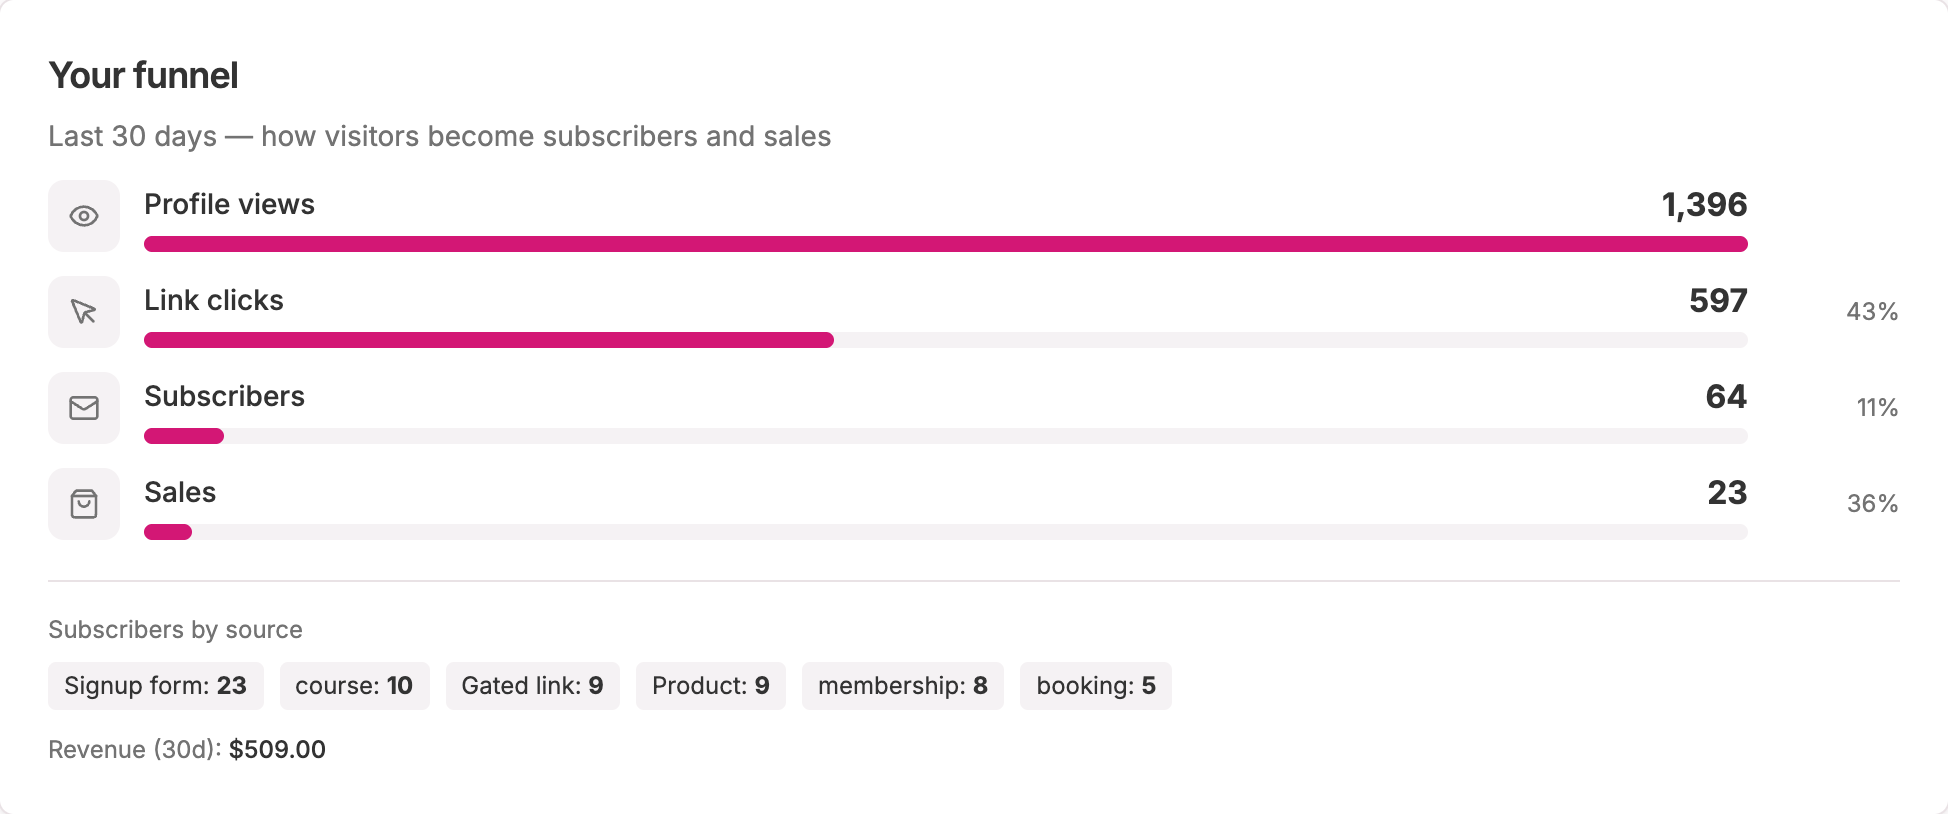
- They take an action. They subscribe, buy, book, join. (Conversions)
Each step loses some people. That's normal. Your job isn't to make the funnel perfect, it's to find the step where you lose the most people and improve that.
On Lynq Pro, the analytics page shows this as Your funnel: how visitors over the last 30 days became subscribers and sales. It's the best place to start.
Profile views: how many people visit
What it is: The number of times your page was viewed.
What it tells you: How well your content drives people to your link. If your content gets lots of views but your page doesn't, people aren't being given a reason to visit.
What to do about it:
- Give people a reason to tap. "Link in bio" alone is weak. "The free checklist is in my bio" is a reason.
- Mention the link in the content itself, not just the caption. Many people never read captions.
- Use story link stickers, which are often easier to tap than the bio link.
- Pin a post that explains what's on your page.
Link clicks: what people do once they're there
What it is: How many times each link, product or block on your page was clicked.
What it tells you: What your visitors actually want. This is one of the most honest signals you'll get, because people vote with their taps.
What to do about it:
- Move the most-clicked items to the top. Seems obvious, but many people keep their links in the order they added them.
- Remove or rewrite links nobody clicks. If a link has been on your page for a month with almost no clicks, it's either not interesting or not clearly described.
- Compare clicks with your intentions. If your most important link (your product, your booking page) is getting fewer clicks than "My favourite camera gear", look at its title and position.
Click-through rate: views vs clicks
What it is: The share of visitors who click at least one thing.
What it tells you: Whether your page is doing its job. If lots of people visit but few click, your page isn't convincing them.
What to do about it:
- Cut the clutter. Too many choices often means fewer clicks. Five clear links usually beat twenty.
- Make the first thing count. The top of your page is what everyone sees. Put your most valuable offer there.
- Write link titles like a human. "Free 7-day meal plan" gets more clicks than "Resources."
Traffic sources: where your visitors come from
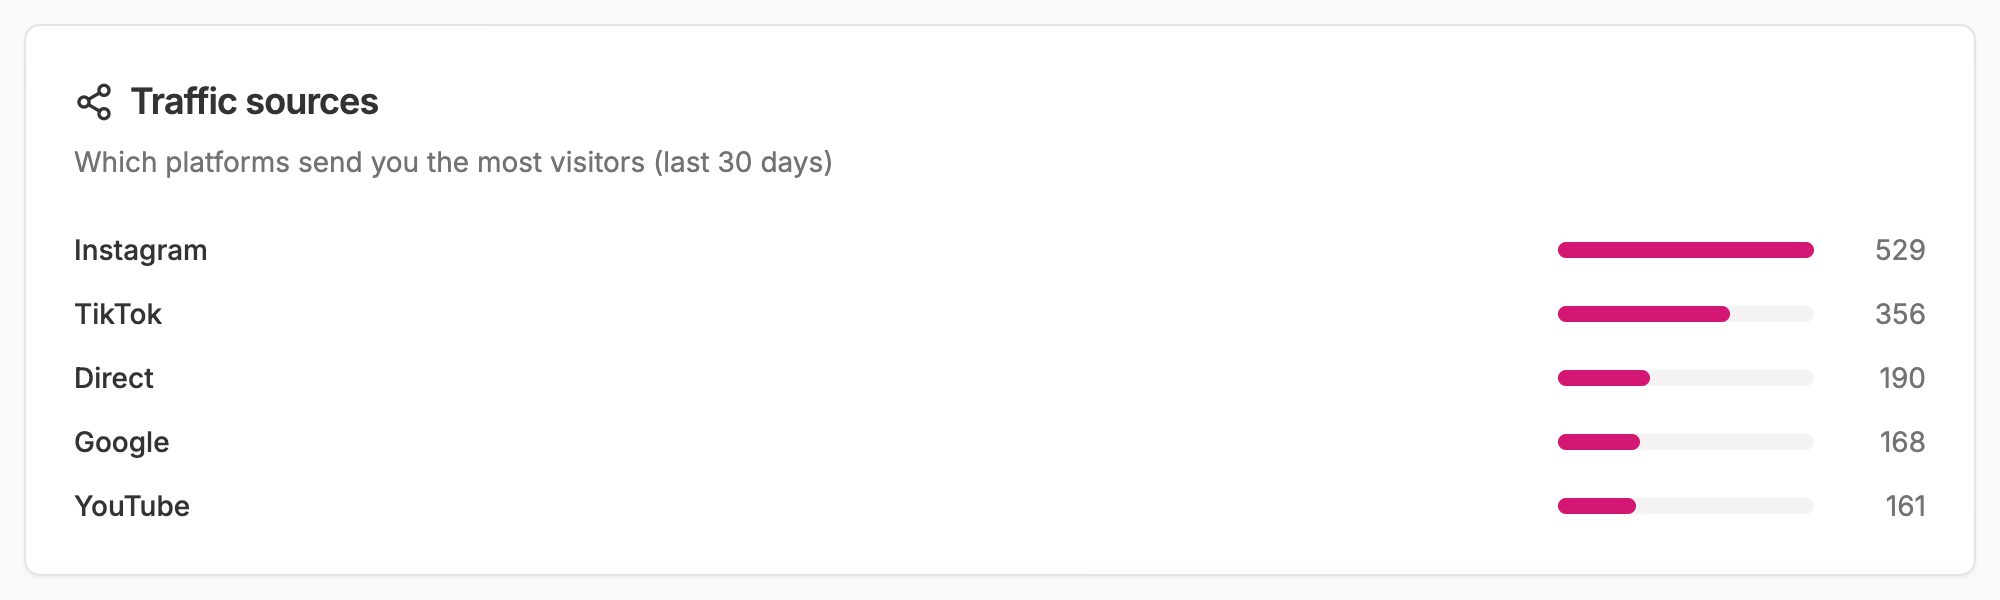
What it is: Which platforms or websites sent people to your page — Instagram, TikTok, YouTube, X, a newsletter, Google, or direct visits.
What it tells you: Which of your channels actually drive action, which isn't always the same as which channels have the most followers.
This is often the most surprising chart for creators. You might have your biggest following on one platform but get more visitors from another. A YouTube video from two years ago might still be sending traffic every week. A smaller newsletter might drive more clicks than a big social account.
What to do about it:
- Double down on the channels that convert. If YouTube sends you three times more visitors than Instagram despite fewer followers, YouTube deserves more of your time.
- Fix channels with big audiences and little traffic. If a large account sends almost nobody, you're probably not giving people a reason to click.
- Find hidden traffic sources. Unexpected referrers (a blog that mentioned you, a forum thread) can be opportunities worth nurturing.
Lynq turns messy referrer URLs into friendly platform names, so you see "Instagram" and "TikTok" rather than a wall of technical links.
Location: where your audience lives
What it is: The countries and cities your visitors come from.
What it tells you: Practical things that affect how you sell.
What to do about it:
- Price and currency. If most of your buyers are in Europe, consider pricing in euros.
- Timing. Post and launch when your audience is awake.
- Language. A big audience in one country might be worth content in their language.
- Brand deals. Brands care a lot about where your audience is. Real location data is a strong addition to your media kit.
Devices: phone or computer?
What it is: Whether visitors are on mobile, desktop or tablet.
What it tells you: Most link-in-bio traffic is mobile, because it comes from social apps. But it's worth checking, especially if you sell things that people tend to buy on a computer.
What to do about it:
- Test your page on a phone. Every link, every product, every checkout. If most of your audience is mobile, that's the experience that matters.
- Keep things easy to tap. Short titles, clear buttons.
- If you have lots of desktop traffic, it probably comes from YouTube, newsletters or search. Those visitors may be in "research mode" and like more detail.
Peak times: when people click
What it is: A heatmap showing which days and hours your links get the most clicks.
What it tells you: When your audience is most active and most ready to act.
What to do about it:
- Launch at peak times. Announce new products when your audience is actually around.
- Schedule promotions to land just before your busiest hours.
- Plan your posting. If clicks peak on Sunday evenings, that might be a great time for your weekly content.
Week over week: are things getting better?
What it is: How this week compares to last week.
What it tells you: Whether what you're doing is working. One week's numbers mean very little. Trends mean a lot.
What to do about it:
- Change one thing at a time (a new link order, a new title, a new top offer), then compare the next week.
- Don't panic about single bad weeks. Look at the direction over a month or two.
- Notice what caused spikes. If one post doubled your visitors, what was different about it?
Subscribers by source: where your list grows
What it is: Which parts of your page bring in new email subscribers — your signup form, a lead magnet, a gated link, purchases, bookings or a waitlist.
What it tells you: Which of your list-building tactics actually work.
What to do about it:
- Invest in what works. If a gated link brings in far more subscribers than your regular signup form, create more gated content.
- Fix what doesn't. A signup form with almost no subscribers probably needs a better reason to sign up.
For more on this, see our guide to growing your email list from your link in bio.
A simple monthly analytics routine
You don't need to check analytics every day. Once a month, spend 15 minutes on this:
- Check the funnel. Where are you losing the most people?
- Look at your top links. Reorder the page if needed.
- Check traffic sources. Which channel deserves more attention next month?
- Look at peak times. Plan next month's launches and posts around them.
- Pick one thing to change. Just one. Then check the result next month.
That's it. Small, consistent improvements beat obsessively refreshing a dashboard.
What's included on Free vs Pro
On the Lynq Free plan, you get the basics: click counts for your links, so you always know what's popular.
On Pro, you get the full picture: profile views, clicks over time, week-over-week comparison, top links, traffic sources, locations, devices, the peak-times heatmap, recent activity, subscribers by source and your conversion funnel — plus stats for your short links.
The short version
- Views tell you if your content drives people to your page.
- Clicks tell you what people want.
- Traffic sources tell you which channels actually work.
- Locations, devices and peak times tell you how and when to sell.
- The funnel tells you where to focus.
Numbers aren't the goal. Better decisions are. Pick one insight a month, act on it, and your page will get steadily better at turning followers into subscribers and customers.
Want to see where your visitors really come from? Create your Lynq page and upgrade to Pro for the full analytics dashboard.